One way to get your logs back into OCI is to use the out of the box Custom Log Monitoring agent. The other way is to install Fluentd manually, and that is what we are going to do so we can keep control of the output my way and get it onto Object Storage for further analysis.
First is to follow the instructions located here and install fluentd, then activate and enable the service with systemctl. Second step is to navigate to /etc/systemd/system/td-agent.service and edit the file, just change fluentd user to root user like so below, the service now run as root. (which is not great for security but let’s leave that aside for a moment.)
[Service]
User=root
Group=root
and restart the systemctl to reload the configuration with systemctl daemon-reload
Third, navigate to the configuration file and enter this configuration, we are monitoring the httpd access log in our case, check the <source> paragraph below; We are sending the logs to OCI object storage, the @type s3 works perfectly in this situation as OCI offers s3 compatible APIs. The <buffer> configuration allows you to change multiple output parameters and in my config the agent outputs .json files onto my ‘compute_log_bucket’ bucket storage. Change aws_key_id and aws_sec_key with the corresponding entries from OCI, instructions are here.
<source>
  @type tail
  format apache2
  path /var/log/httpd/access_log
  pos_file /var/log/fluent/httpd.access_log.pos
  tag s3.apache.access
</source>

<match s3.*.*>
  @type s3

  aws_key_id key
  aws_sec_key secret
  s3_bucket compute_log_bucket
  s3_region uk-london-1
  s3_endpoint https://namespace.compat.objectstorage.uk-london-1.oci.customer-oci.com
  path logs5/
  store_as json

  <format>
    @type json
  </format>

  <buffer>
    @type file
    path /var/log/fluent/s3
    timekey 1h
    timekey_wait 5m
    chunk_limit_size 128m
    timekey_use_utc true
  </buffer>

  time_slice_format %Y%m%d%H%M
</match>
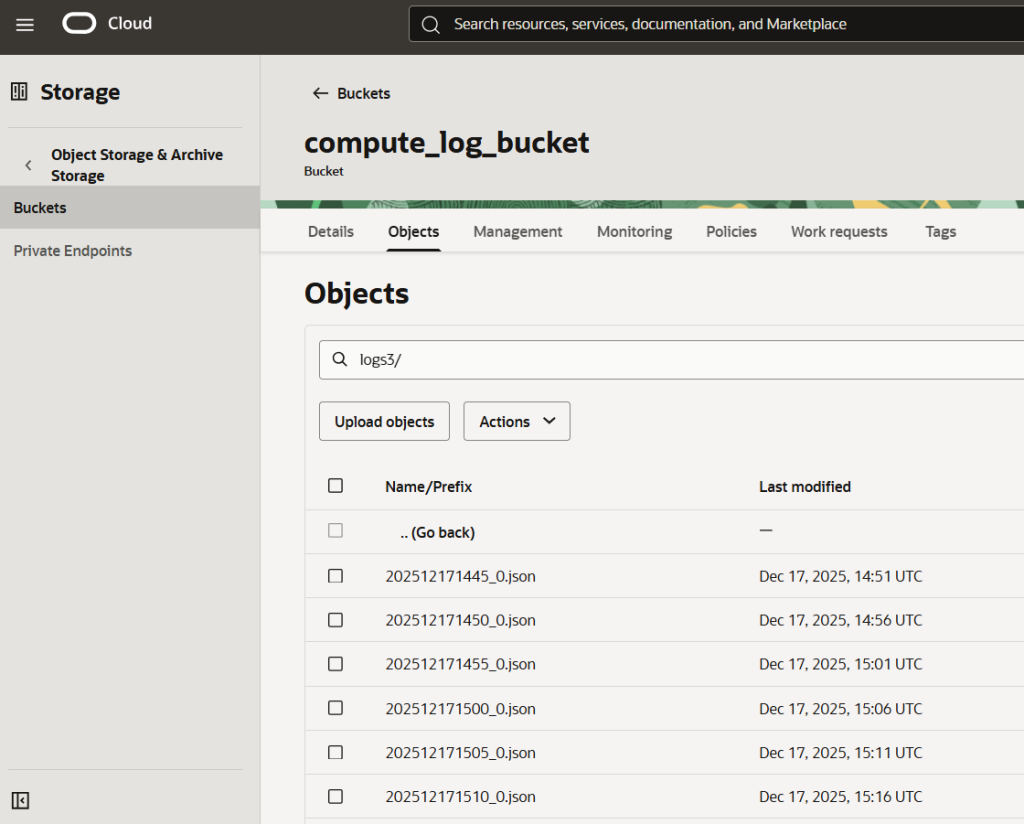
Lastly enable auth principal with a dynamic group and the corresponding policy so your source VMs can write onto an Object storage bucket. That’s what the result would look like:
And that’s great, because now you’ve got tons of log data dumped into cheap storage. The idea then is to have this raw data available to perform any type of analysis and unlock the power of a Lakehouse platform. In this case I will use the Oracle AIDP (AI Data platform), which is an all in one big data and AI toolbox.
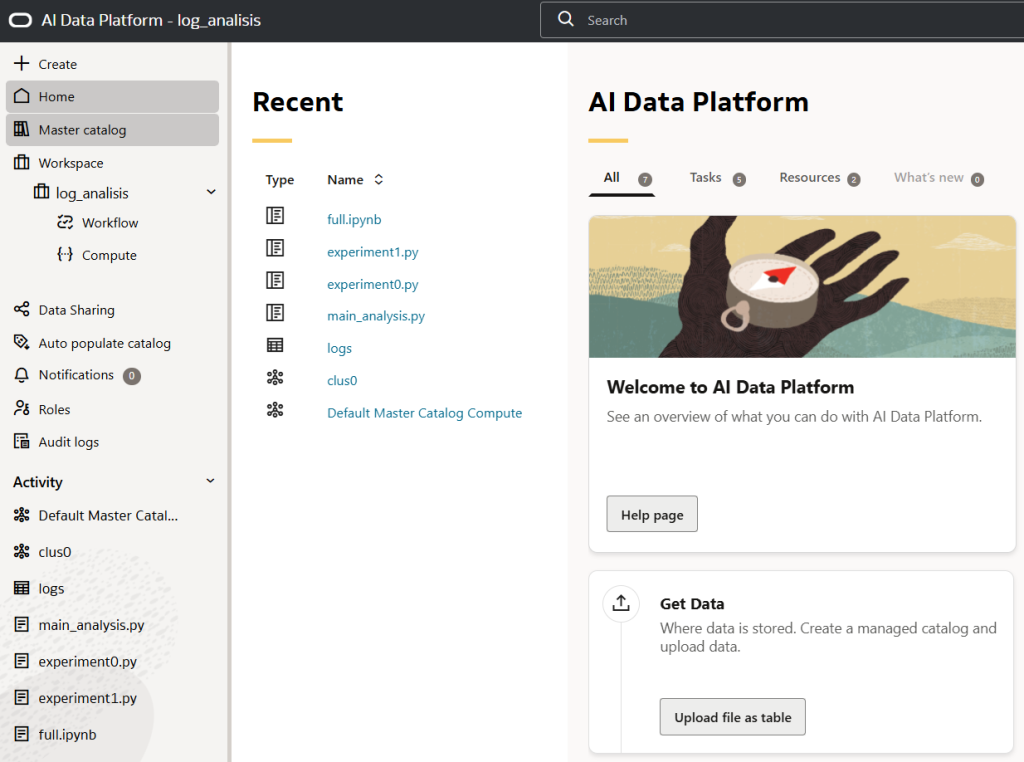
On this toolbox you can organise your data sources, assign ownerships, spin up Spark clusters, layout governance, all in the click of a button and it will abstract the complex set-ups in the back-end to get it running, also call in AI models directly.
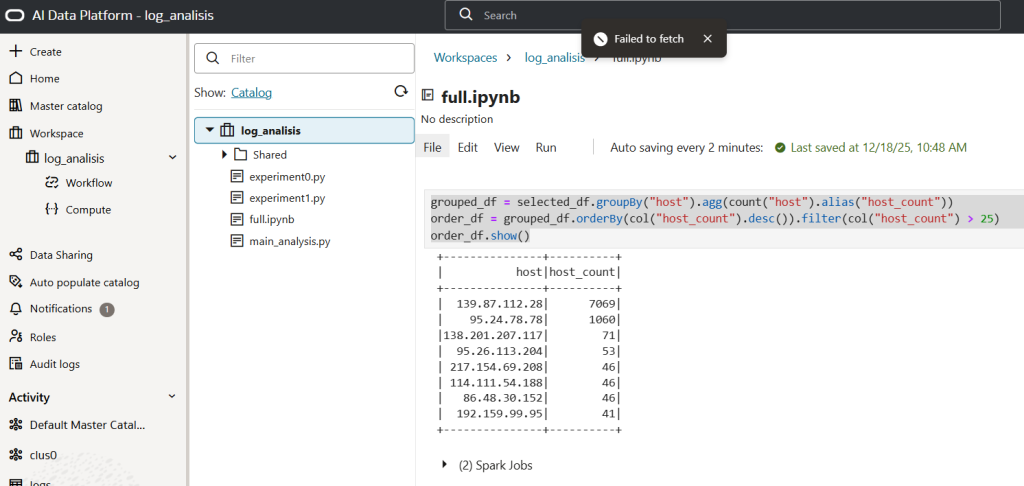
Let’s spin up a Spark cluster and analyse the logs coming from my VMs, and again these are webserver access log, so why not have a look at where the requests come from. We’ve got to imagine that at scale we would monitor hundred or thousands of machines and join together a lot of data to perform our analysis, hence the requirement for Spark. Also, this model could serve as a basis for a near real-time monitoring cockpit, so we could ban troublesome clients.
The code is here if you are curious… but in a nutshell – We put together a dataframe and aggregate the number of visits by hosts
Let’s now have a look at where the mystery visitors come from
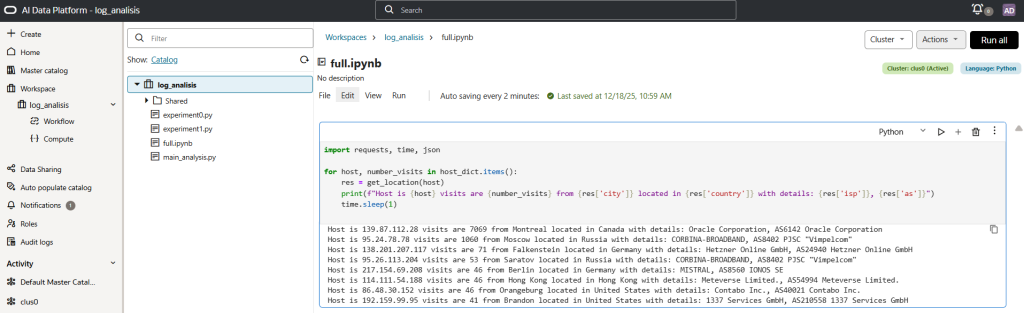
And we have got as top three, drumroll please:
- Host is 139.87.112.28 visits are 7069 from Montreal located in Canada with details: Oracle Corporation, AS6142 Oracle Corporation
- Host is 95.24.78.78 visits are 1060 from Moscow located in Russia with details: CORBINA-BROADBAND, AS8402 PJSC “Vimpelcom”
- Host is 138.201.207.117 visits are 71 from Falkenstein located in Germany with details: Hetzner Online GmbH, AS24940 Hetzner Online GmbH
It is likely we see as a first entry an automated scanning machine from the infrastructure owner, and also on second and third position we can see a fair amount of internet probing (likely?)
In conclusion, we installed fluentd on a fleet of machines and it was easy to consolidate logs into object storage. We leveraged these logs for analysis and worked on them from an end-to-end toolbox like AIDP to detect unusual patterns or data.
Talk soon!