How can we cut through a large amount of information and get the business insight and answers we need? Data Operations team are familiar with this question and are used to make humongous amounts of logs actionable. Let’s build a visually appealing dashboard and augment it with an LLM chat capability ready to help the end-user further with natural language.
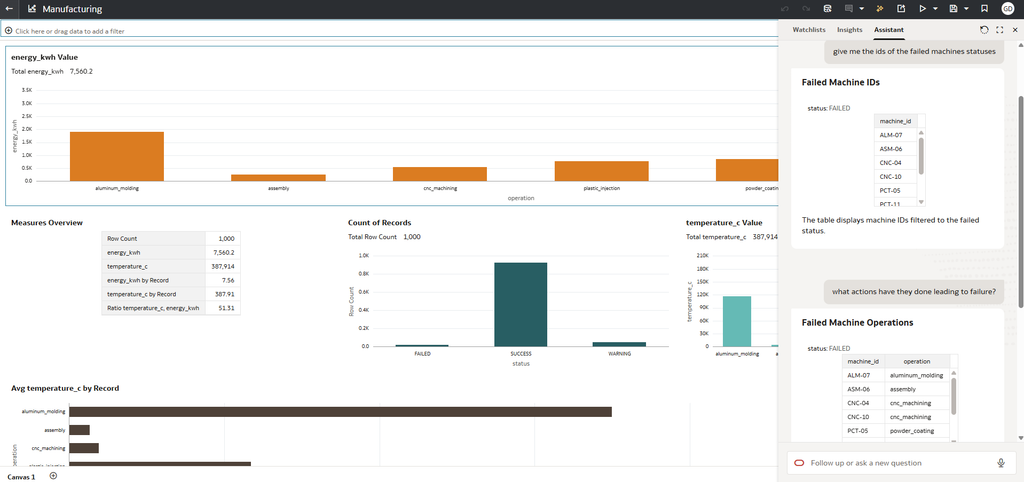
In a previous blog post I wrote about data ingestion and I discussed about the use of the Fluentd agent to collect logs. Today, I shall focus on the “above” layer and the end user UI, and how to put the components together to achieve a complete end to end solution.
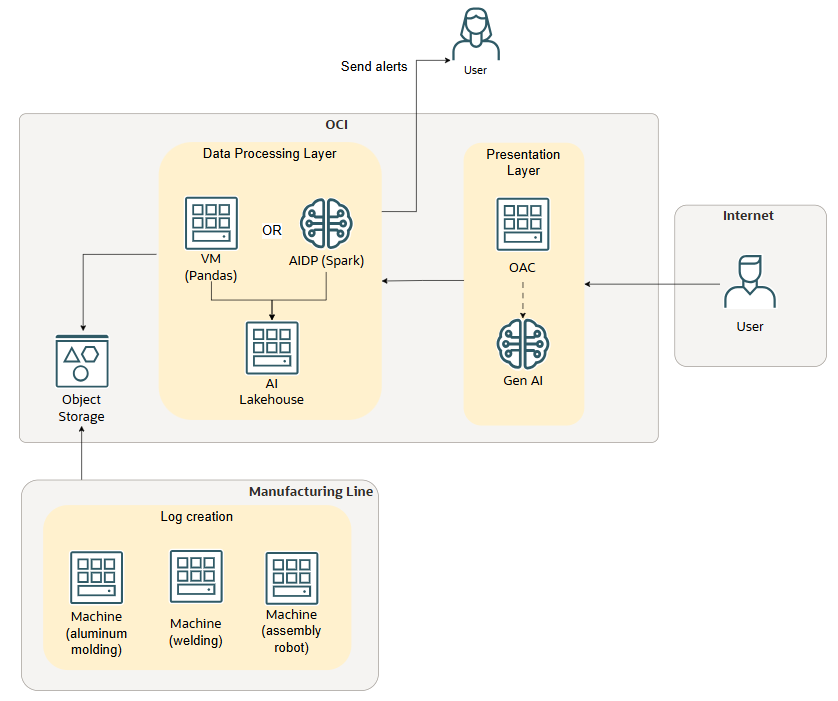
At the bottom of the architecture we have three robots, let’s imagine for an instant we are looking at a manufacturing line. We would collect every now and then thousands of rows of log entries from the assembly line. In real life, there may be a benefit in going as close as possible to real-time, the technological components used could vary but the overall concept would stay the same.
Example of a log coming in as a JSON entry.
{"timestamp":"2026-07-22T08:15:02Z","machine_id":"ALM-01","batch_id":"B1001","operation":"aluminum_molding","start_time":"2026-07-22T08:10:00Z","stop_time":"2026-07-22T08:15:00Z","cycle_time_sec":300,"energy_kwh":14.2,"temperature_c":695,"pressure_bar":121.5,"status":"SUCCESS"}These would be collected via any software of your liking e.g. rsync or Logstash, and be sent to an object storage for cheap data persistence and audit. Nowadays machines, robots and other instruments tend to have a full computer attached to them, which make it easy to select our favorite software for the task.
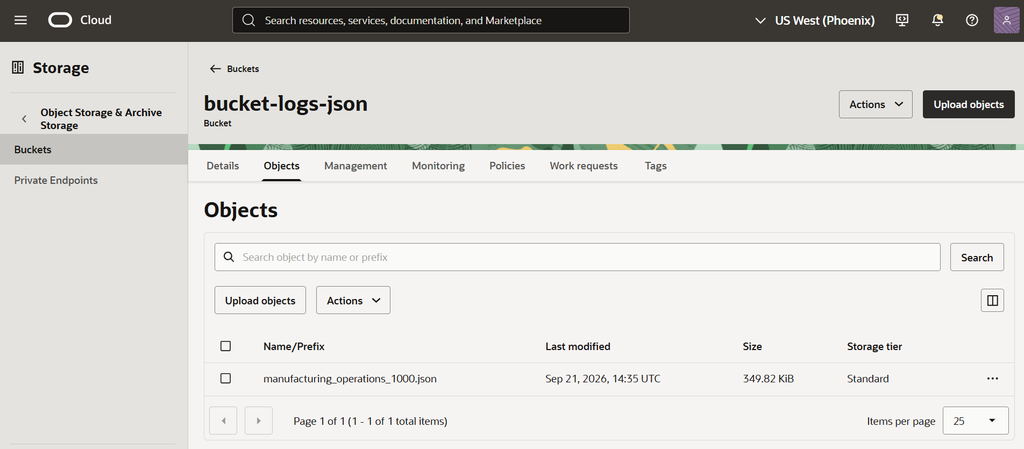
Once our data is collected and lands on object storage. We want to transform its syntax, parse it and format into a structured layout. For this task AND in an enterprise scenario with loads of input streams I would use an AI Spark workbench such as Oracle AI Data Platform. It would do well in this scenario and would be even more relevant if Data cataloging and AI Agents were required. In my demo scenario here it is completely overkill to use AIDP for parsing and you would use either SQL directly on the AI Lakehouse, Pandas on a VM or functions. Again, it is up to you to decide what works best for data preparation.
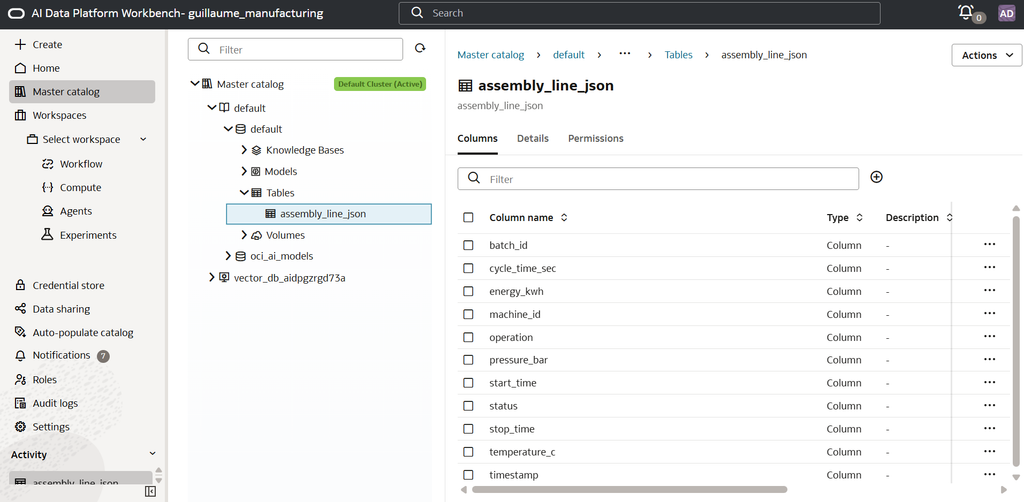
Onto AIDP now; Let’s mutate our JSON entries into a dataframes objects and perform some transformations, in my instance I would simply check what are the top 10 most energy hungry machines, they are all related to steel forging, which make sense to me.
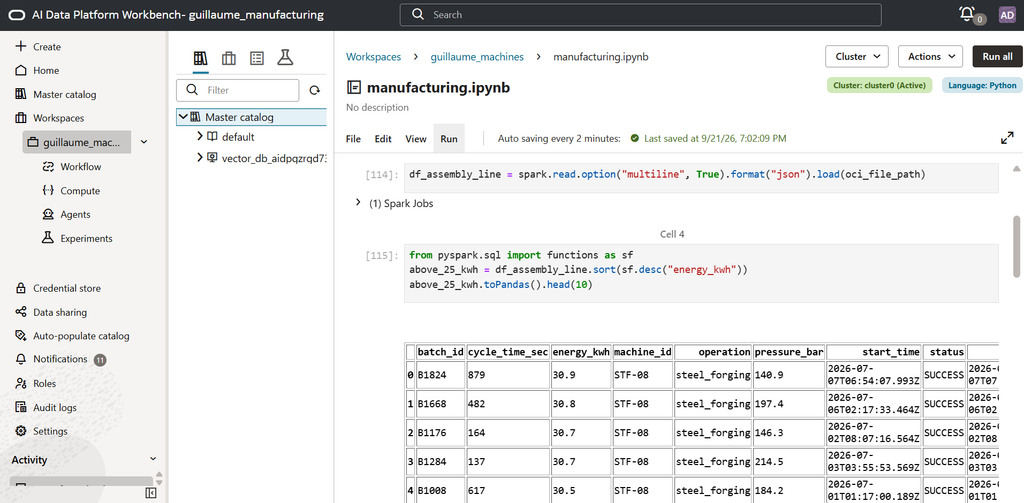
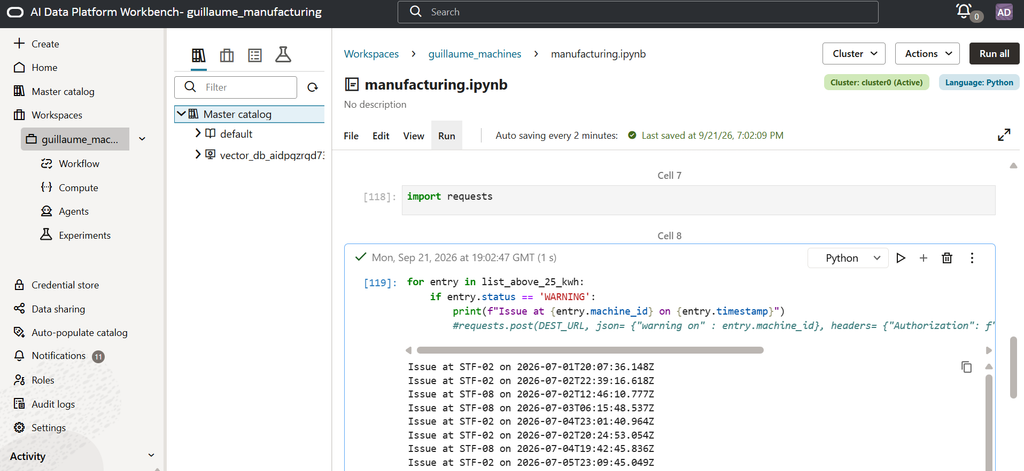
This python notebook can be scheduled to run in a loop like fashion so we can continuously check for anomalies and send to users (e.g. the plant manager) proactive warnings by calling out to other systems like Oracle Field service or its phone messaging via API, for this I use the request library. In my example I check the statuses of our machines.
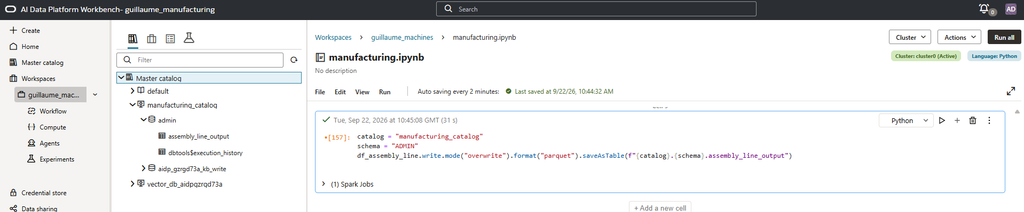
Let’s now send our dataframe into Autonomous DB and make sure that the AIDP service has the correct policies attached to it so it can write to the destination service. Remember that if you move or write information from one service to another you need to be familiar with policies.
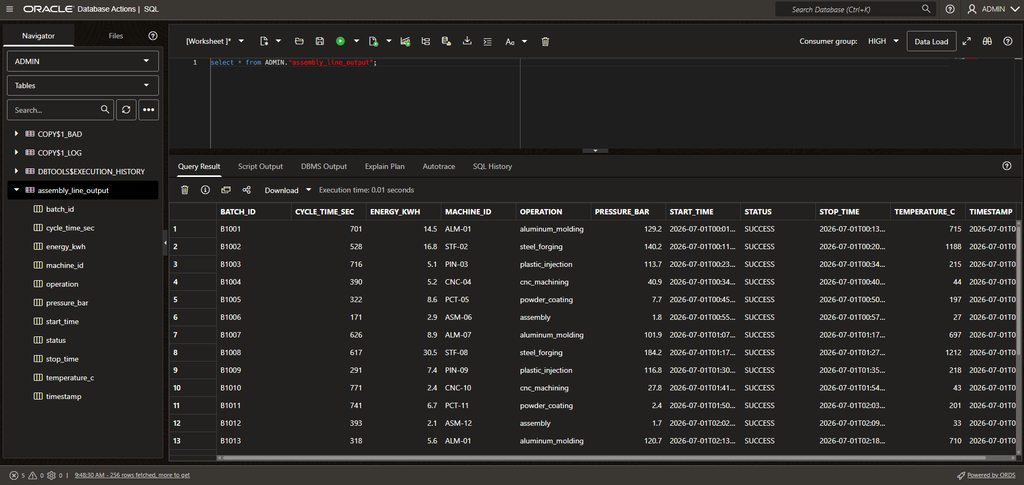
I am using database actions, an online and embedded SQL developer environment into the OCI console, that’s very handy.
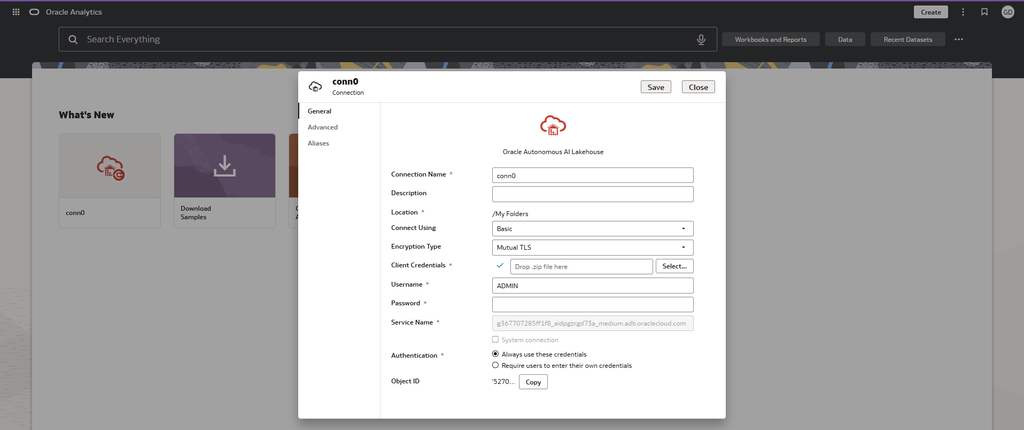
Launch an OCI Cloud Analytics instance. First, create a connection to Autonomous Lakehouse, download the wallet connection from the database OCI console.
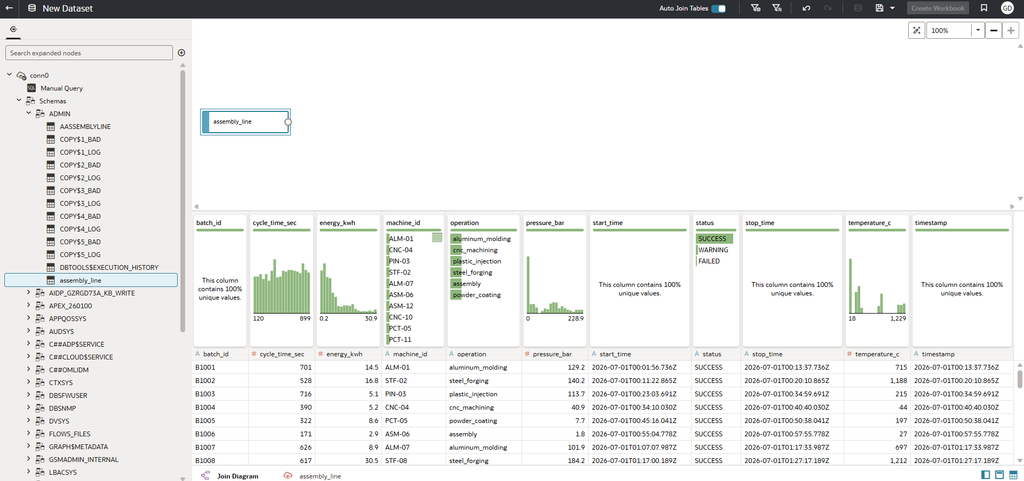
Create your Cloud Analytics dataset
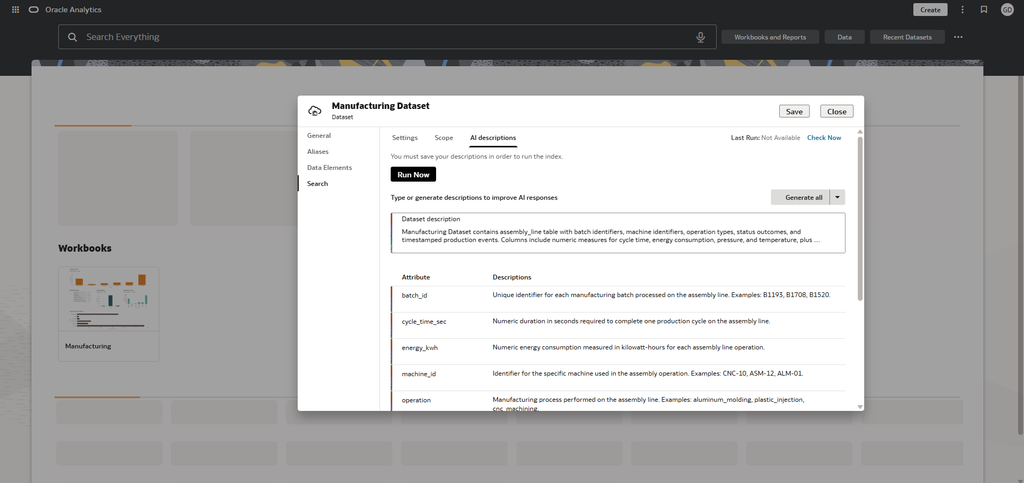
Enable AI annotations, and there is no manual input here, there are made for you in a few seconds, this is very slick. This step is required for the LLM to “learn” from your data.
Finally create the end-user dashboard, notice that you do not have to create any widget manually, the software suggest them to you and you decide what to add to the dashboard canvas. Notice now the LLM bot on the right hand side, since we agreed to AI indexing in the previous step, we can now chat and get answers from the data. Please note you could also power this feature with the model of your liking, out of scope here.
And that’s it! So we have created:
- A manufacturing cockpit with LLM powered dashboard to augment productivity and allow for proactive fault investigation
- Alerting system set-up for triggers if certain thresholds are met
- A sensor, robot and machine data gathering system in real or near real-time
- A parsing, cleaning and grouping of data at big data scale using clusters of commodity hardware (Spark)
- Long term storage of logs in cheap data persistence layer with Object storage
This use case would work with any type of logs and I leave it to you to extrapolate it to your own monitoring use case.
See you.